METU JFA Guide for the Preperation Of Visual Materials
METU Journal of the Faculty of Architecture is published biannually both in print and online.
For the printed version that is published with offset publishing technique, the visual materials are required to have specific dimensions and qualities. These measures that are related to technical properties of offset printing may seem to cause some limitations on behalf of the authors, but they are compulsory for printing. At the Journal of the Faculty of Architecture the standard is determined as a minimum of 10 cm width and a resolution of 300 dpi (ppi) (or width at least 1200 pixels) in accordance with the format of the Journal. The visual materials are required to be presented in tiff file format. Below some principles and helpful information are given in order to guide the authors to prepare their visual materials properly.
Resolution
By explaining the issue that is most relevant to us at the beginning, we are hoping to make this guide clearer.
It can be supposed that in a digital photograph a certain amount of image is stored. Thus, in a 1 inch x 1 inch area of a photograph, there are a certain number of dots or pixels (image points). The quality of the photograph is based on the amount of information stored. If your have a digital photo that you want to use in your paper, how can you know whether it has the required resolution?
First of all you have to use an image processing program*. There are a number of licenced and free programs that can be used for this purpose with “Adobe Photoshop” as the most common one. In almost all of these it is possible to follow a similar route. For example in Adobe Photoshop, within the image menu, image size tab provides you the necessary information. When you examine the photo you want to use with image size and see data as in Figure 1, it means that image size is 623x381 pixels.
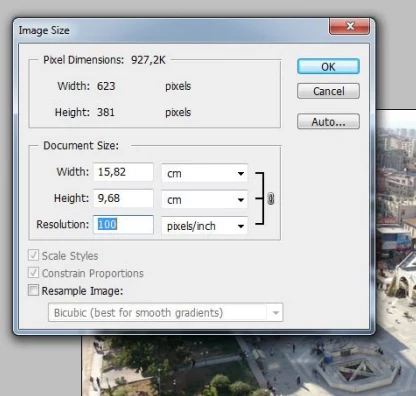
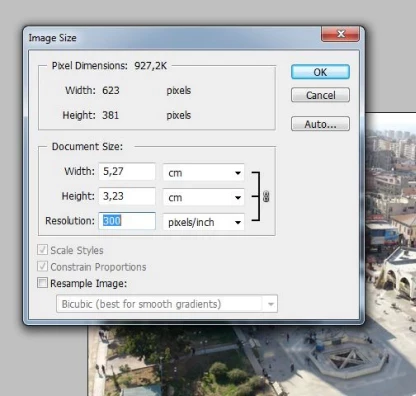
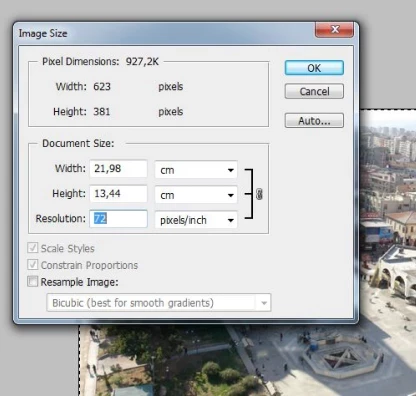
Figure 1. How do the dimensions change in different resolutions?
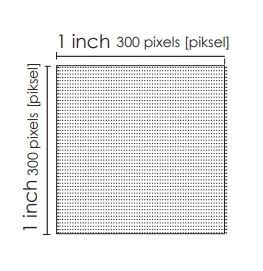
When set to a resolution of 100 dpi, dimensions will be seen as 15,82cm x 9,68cm (100x100 pixels in 1 inch x 1 inch will give the size above.) When set to 300 ppi, the dimensions will be 5,27 cm x 3,23 cm. Therefore, in order to be printed at the Journal, the maximum size available seems to be 5,27 cm x 3,23 cm. And this size is rather small and can only be used in a visual material without details.
If we would like to use this on a computer screen, then 72 dpi would be sufficient. A material with a resolution of 72 dpi could be used with the dimensions of 21,98 cm x 13,44 cm. Thus, a visual image that can be insufficient for print, can seem to be fine on a computer screen. However, this generally misleads the authors.
Therefore, when we set the image resolution as 300 dpi (without marking the resample image box), we can see which size the image can be used.
What we have to consider here is that, when we change the resolution of the photo, the number of pixels do not change. It means that the information on the photo is constant, and changing this would not make the photo better. Based on the fact that the number of pixels are constant, for the ones who are not familiar to image processing programs, another method may be suggested. The pixel information for each image may be seen in many operating systems. For example in Windows operating system, when you select a photo file in a folder, pixel information is given right under the window:

The size of the photo seen in Figure 2 is 2362 x 1575 pixels. Here, by examining Table 1, the size of the photo in 300 dpi can be seen. This dimension will correspond to slightly over 2200 x 1400 pixels at the table. Therefore, it can be seen that the visual material may be printed at the size of 18,63 cm x11,85 cm. This is a quite sufficient size for print. Since Table 1 shows the dimension interval that can be used for the METU Journal of the Faculty of Architecture, it is important for the authors to check whether their visual materials fall within this interval.

Table 1. By looking at the pixel size in 300 dpi resolution, it is possible to see the size it can be printed. Actually since dpi means dot per inch, if we used the measurement unit as inch, 100 pixels would be 1200/300=4 inch at 300 dpi. This is 10,16 cm as seen in the table.

Figure 3. If the visual quality of a visual document is evaluated as insufficient, resampling the image or enlarging in any other way does not solve the problem of resolution. Also if you have found out that the quality of an image you want to use is not suitable, enlarging it does not make it convenient for print. Above a 72 dpi image on the left has been made 300 dpi while the resample image box is marked and it resulted in a blurred image.
Resampling Image
Another mistake that recurs quite often is trying to enlarge an insufficient image using the image size menu or some other programs. Resizing the image after marking the resample image box does not increase the existing information on the image, but only adds similar pixels around the ones at the image and enlarge it artificially. Although the image that is obtained with this method is larger, since it is produced by stretching the smaller one, it results in a blurred image*.
Image Size in Accordance with the Property of the Image
Here we may consider whether printing the image at its dimensions at 300 dpi is sufficient, based on the level of detail the image contains. For example, the visual material at Figure 4 on the left was published at the journal at a size of 4,8 cm x 7 cm . This size may be insufficient for a photo containing lots of details, but enough for revealing the details of the object on the particular photo. However, in order to provide some flexibility for the page layout of the journal, it is always important to keep the width of the photo at a minimum of 10 cm.
While 72 dpi resolution may be sufficient on a computer screen, images that are obtained from the internet may not always be enough for printing purposes.** That is because in order to keep the file size small, large files are not preferrably used on the internet.
Thus, a photo with a size of 20x20 cm on internet (at 72 dpi) can be as small as 5x5 cm (300dpi) in print which prevents the transfer of the required information. The same problem can occur with the images obtained by screen capture. Especially maps and plans like the ones in Figure 4 with legend information can in now way transfer any information at a width of 5 cm no matter how clear they seem to be at the screen. However, a photo like the one in Figure 5 showing a detail of a texture would be used at a 5 cm column, no matter how big the original file is.
Resampling can be useful only if you have a very large image at hand because a large picture will also have a large file size that will cause delays and problems during the uploading
process. Therefore, if you have a file size over 15 MB, it would be appropriate to examine in image processing programs and with resample image box marked, set the pixels at a maximum of 2400. This way you would have brought the image to the necessary size and would not have to upload a file that is far too big than the required size.
* In some cases a file that is obtained from the internet or some other source may be enlarged by resampling. In order to see if this is the case, you may examine the image in ‘actual size’ in image processing programs or windows image viewer and check if the image is clear.
** Information on the visual material on the internet is about the visual quality. The issue of copyright is discussed in the author guideline of the journal.
Photograph and Figures
The printed and dia photos that used to be utilized as visual materials for print have today left their places to digital files. Generally, authors prefer to use the digital images that they obtain with their personal cameras or from other sources. In order to provide that digital photos satisfy the required quality, the size of the photo and the resolution of the camera are important factors. Since there is an overwhelming variety today, including even cellphones, the best method may be checking the image size after a trial photoshoot.
If a visual material is obtained by scanning from a printed photo or book, the resolution has to be set as 300 dpi during scanning. However, if a drawing is 5cmx5cm and you want to use it as 10cmx10cm, then you would have to scan it as 600 dpi. That is why slide films are generally scanned in resolutions like 2400 dpi. Because the size of a slide film is approximately 2,5 cmx 3,5 cm. In order to obtain a size appropriate for print, a detailed scan is necessary.
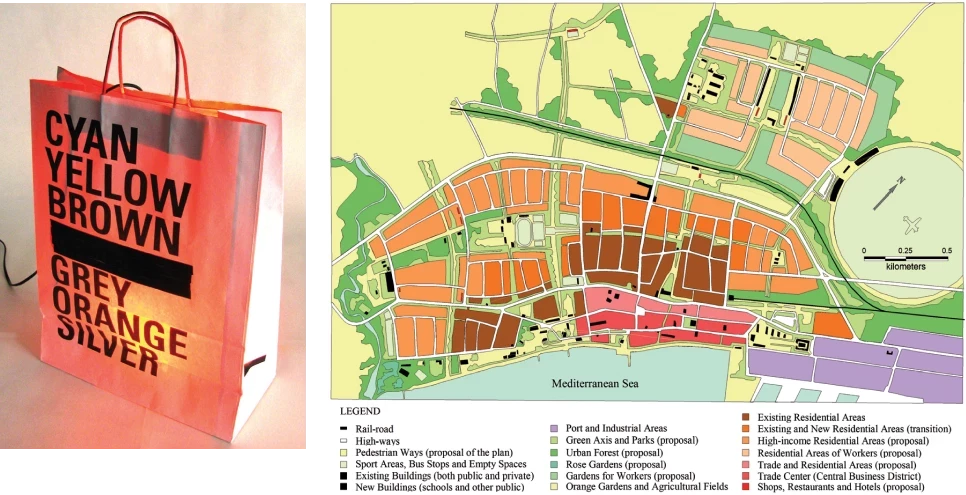
Figure 4. Based on the content, it is possible to convey enough information with a small image (left) and not enough information even at 10 cm width in a detailed image with legend (right).
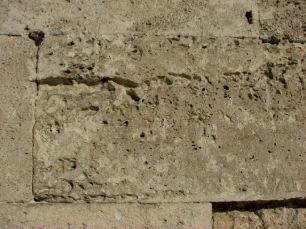
Figure 5. Based on the information to be communicated, some images are covered in the column or within a group of pictures.
Charts / Flowcharts
Charts are generally produced in programs like Microsoft Excel. It is known that various specialized programs are used in different areas of study. Again, it is not suitable to obtain visual materials from these programs by screen capture. Most of these programs have image export options.
During the export process, the program requires information on the resolution. During this process, the aformentioned resolution and dimension requirements are valid. Because in this sort of charts the shapes and text may be blurred. At the same time the size of the text should be adjusted to be suitable for the size the chart is to be printed.
Sometimes it may be necessary to add some signs and text on some images. Here if vector based programs like “Adobe Illustrator” and “Corel Draw” are used, the files have to be converted to tiff, jpeg or pdf formats at a suitable resolution. If
instead of these programs “powerpoint” or “word” are preferred, a print quality material should be obtained using pdf writers*. This way any mistakes may be prevented. It should be noted that all this effort is for presenting the visual materials of the papers that the authors have prepared meticulously, to their readers as neat as possible.
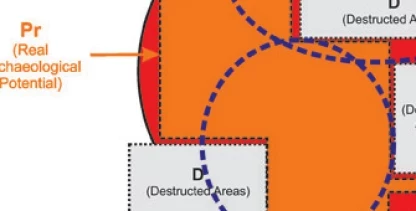
Figure 6. Poor quality causes blurred texts in charts and flowcharts and cre- ates problems of legibility.
* Pdf writer programs have licenced versions like dobe Acrobat Professional, as well as free programs (like primopdf) that can be downloaded from the internet and used in your computer as a normal printer. (http://www.primopdf. com/) The only important issue is that print setup should be made as ‘high quality print’ or ‘prepress quality’ when converting to pdf.
Figure Groups or Images Arranged in Tables
In some papers the author may feel that it is necessary to present some figures or photos in groups. Or some tables that include both photos and texts may be produced. In this case after adding the photos within the table in the suitable resolution, the author has to convert it to pdf or arrange the visuals and produce one photo or table by naming the file appropriately. Because putting numerous files together during the processing of the page layout may make the process vulnerable to mistakes.
Figure 7 is a good example for this case. However, if there are many photos and drawings coming together as in this one, and if there are many of these tables, the size of the Journal should be taken into account when forming the structure of the tables.
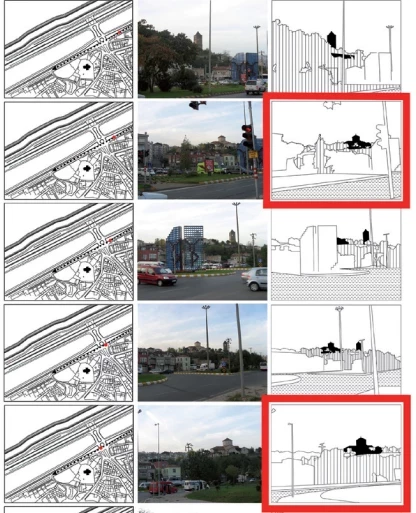
Figure 7.Tables and images with multiple visual documents should be prepared as a single image in the proper quality.
Use of Color
Another major difference between the screen view and print is the manner color is obtained. While RGB color space is used for the screens, in print there is a four colored printing space as CMYK. If it is not absolutely necessary, color should not be utilized in the visual materials and the maps, graphics or photos that may be expressed in black and white should be uploaded as grayscale. This can be obtained in Adobe Photoshop with image>mode>grayscale tabs. Especially in graphics that are prepared using Microsoft Excel (Figure 8) gray tones and patterns may be used to diminish the use of color.
If it is necessary to use color, for example there is a map where the legend information cannot be given without color, then in the mentioned tab it is necessary to convert to the CMYK Color. A slight difference in the tones of RGB and CMYK may be seen right away in some cases after the conversion. Maybe this may effect your opinion on the visual material. Therefore, it is suggested that you upload color visuals as CMYK. The use of grayscale visual materials is important in terms of the cost and duration of print.
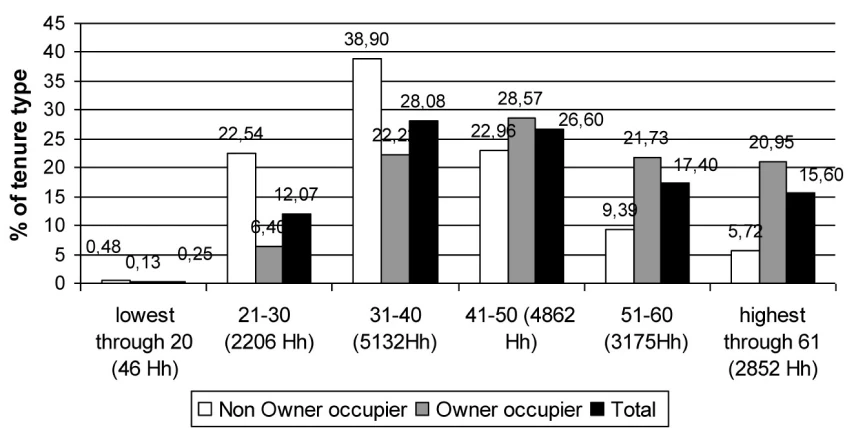
Figure 8. Charts should be prepared in grayscale and use of color should be avoided if possible.
Numbering
Numbering the figures is also an important issue. Especially in papers with lots of visual material, putting these in the suitable places in the paper and numbering afterwards is important in terms of also the numbering of the figure references within the text. It is assumed that figures numbered as 1a and 1b will be used together. This should be taken into consideation for the figure references in the text as well.
Type of File
The reason for demanding the visuals in tiff format is to prevent loss of quality in the visual materials. However, for many different reasons some problems on the quality of the photos may be seen. If the photo that the author obtained is jpeg and if some interventions have to be made on image processing programs (cutting, changing color tones etc.) it is important to send them in
tiff format with LZW compression. However, if a digital photo taken with a digital camera is to be printed as it is, sending it in jpeg will be helpful in order to keep the file size small. At this point it would not be necessary to convert it to tiff.
File Size
The format of the visual material, file type, resolution and whether it is a grayscale or CMYK, all affect the file size. A visual material that is 300 dpi, CMYK and tiff with dimensions that would fill the entire page of the Journal is almost a maximum of 20 MB. Therefore, an average file size, even in colored ones generally turns out to be approximately 10 MB. This number decreases in Grayscale ones and in smaller dimensions.
Obviously, since the content of each paper submitted to the journal is unique and also papers from many different areas of expertise are submitted to METU Journal of the Faculty of
Architecture, this guide can only suffice to give an overall idea.
Evaluation of each paper in this respect is up to the author*. However, being attentive to the quality of the visual material presented is crucial for the Journal to continue publishing in the desired quality. Besides, uploading the papers with visual materials prepared by considering the information presented here would provide a faster and less problematic design process, thus leading to faster publishing.
* Visual material used in the preparation of this guide is taken from the papers that have been previously published at METU JFA. These images are proper and they are only used as examples in order to explain the issue with some interventions when necessary. The contents of this guide is in no way related to the owners of these visual materials.